
COVID-19 | Google’s Community Mobility Report For Florida
MARCH-APRIL 2020
1. Google’s COVID-19 Community Mobility Report.
2. View Complete Florida Report.
3. About This Data.
A Note From Turnkey Mate
While COVID-19 is still spreading in certain areas of the world, companies are starting to adjust and push back against the outfall of this pandemic.
Google prepared the following Community Mobility Report across the world to help us better understand responses to social distancing guidelines related to COVID-19.
“Try not to become a man of success. Rather become a man of value.” – Albert Einstein

1. Google’s Community Mobility Report.
As global communities step up their battle against COVID-19, public health officials have pointed out that the same type of aggregated, anonymized insights Google uses in Google Maps and co, could be helpful communities make better decisions to adjust to COVID-19.
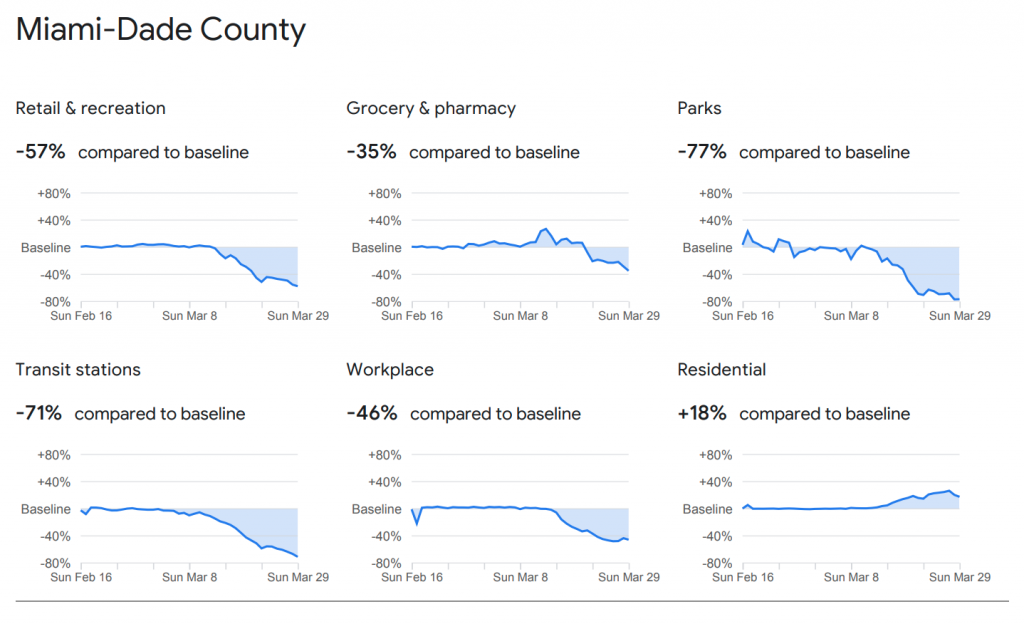
Google’s Community Mobility Reports aim to provide insights into what has changed in response to policies aimed at combating COVID-19. The report charts show trends over time by geographic location, across multiple categories of places such as retail and recreation, groceries and pharmacies, parks, transit stations, workplaces, and residential.
Google Community Mobility Report Of Florida.
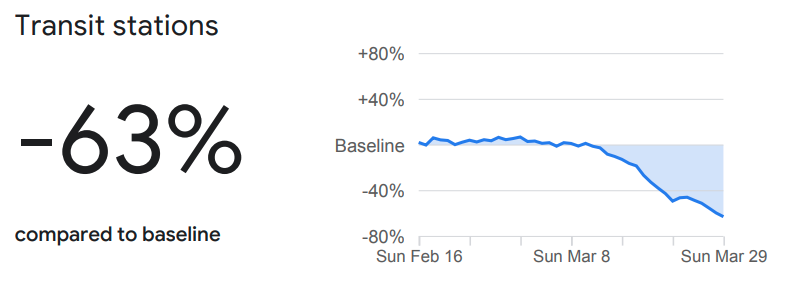
Includes places like public transport hubs such as subway, bus, and train stations.
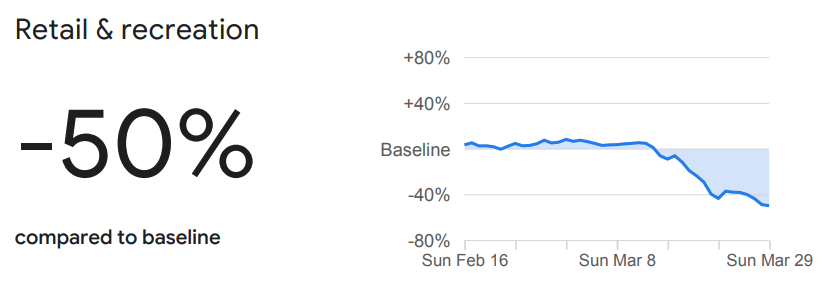
Includes places like restaurants, cafes, shopping centers, theme parks, museums, libraries, and movie theaters.
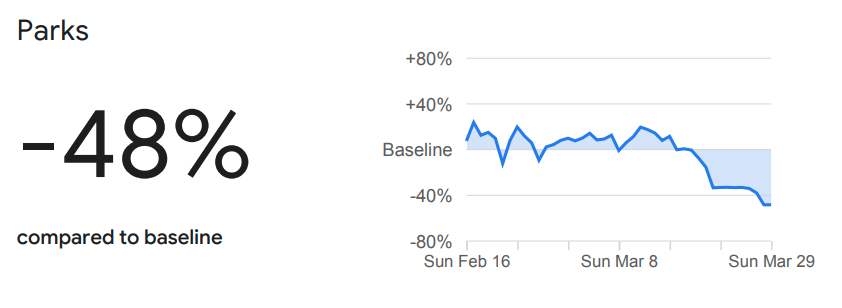
Includes places like national parks, public beaches, marinas, dog parks, plazas, and public gardens.
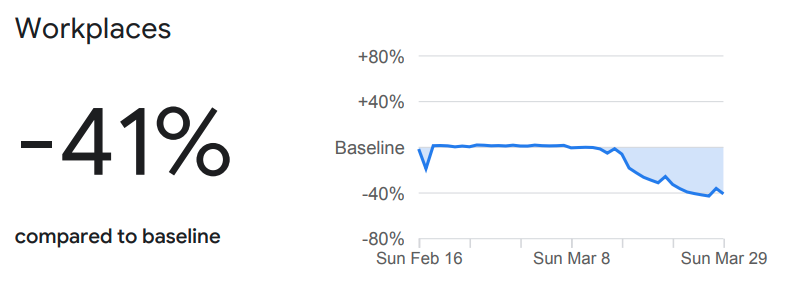
Includes places of work.
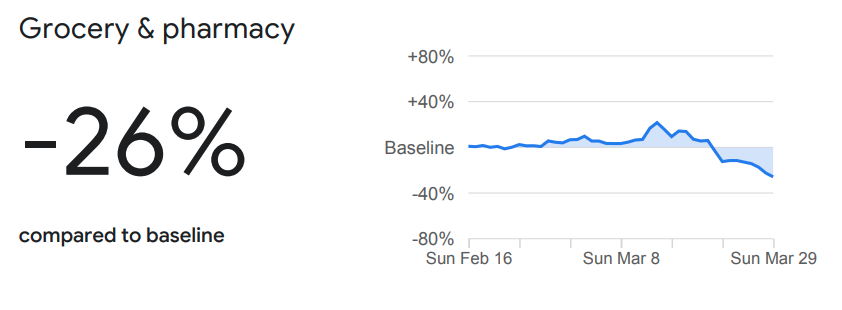
Includes places like grocery markets, food warehouses, farmers markets, specialty food shops, drug stores, and pharmacies.
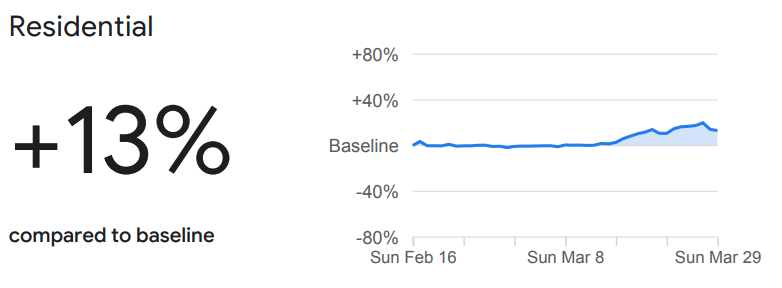
Includes places of residence.
Google Community Mobility Report Of Miami-Dade.
2. View Full Report PDF.
The information provided in this article is directly sourced from Google. Google reserves all rights to the information provided. View the full report by clicking below.
No download or additional information required. To view global reports, click here.
3. About This Data.
These reports show how visits and length of stay at different places change compared to a baseline. We calculate these changes using the same kind of aggregated and anonymized data used to show popular times for places in Google Maps. Changes for each day are compared to a baseline value for that day of the week:
● The baseline is the median value, for the corresponding day of the week, during the 5-week period Jan 3–Feb 6, 2020.
● The reports show trends over several weeks with the most recent data representing approximately 2-3 days ago — this is how long it takes to produce the reports.
Learn more about the data used for this report here.
Is Your Business Affected By COVID-19?
Our team is available to support you with marketing adjustment strategies & tips to optimize your business for COVID-19 market changes. Don’t hesitate, it’s free.